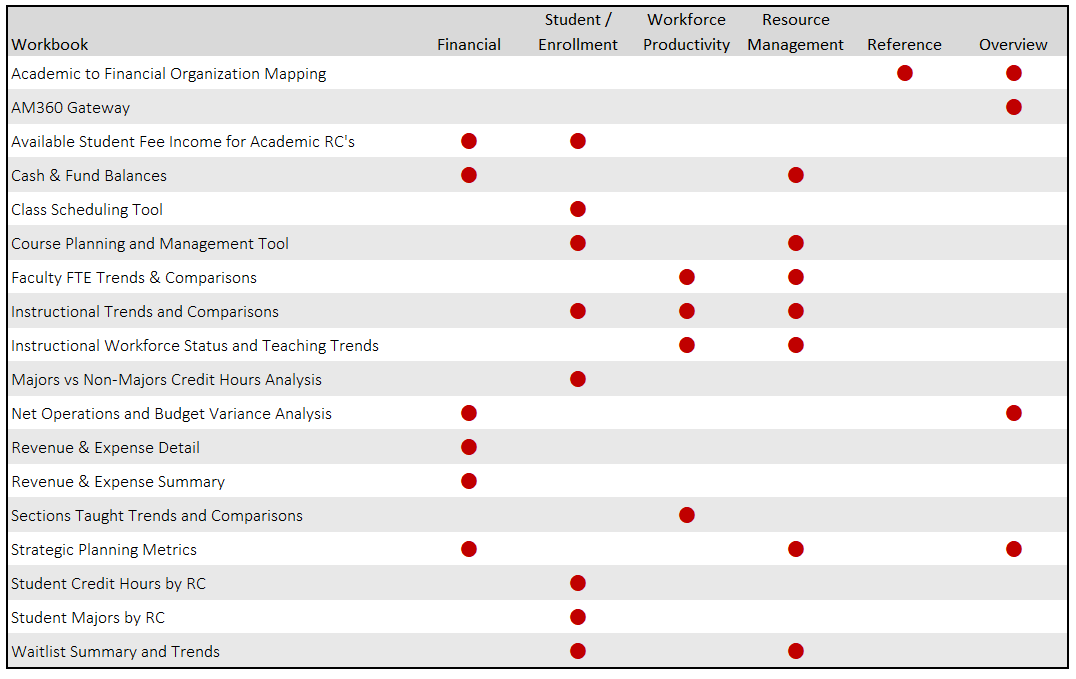
One of the strengths of AM360 is the alignment of data from IU’s financial, student and personnel systems to present integrated information across these subject areas for academic responsibility centers. The table below illustrates how the AM360 workbooks were developed to address a variety of business questions from several perspectives:

Access the Dashboards:
Indiana University personnel can access the AM360 Report Center containing the entire suite of workbooks via One.iu.edu or ds.iu.edu (search for “AM360”). Information about and direct links to each of the workbooks are provided below. These workbooks include anywhere from 1 to 7 individual dashboards designed to address various business questions. Some workbooks are included in more than one perspective when content spans multiple subject areas.
FINANCIAL
Provides academic leaders and administrators a variety of perspectives on fiscal operating results and budget-vs-actual variance analyses for current operating funds.
Illustrates trends in revenue and expense components by Consolidation and Fund Group, with drill-down to detailed Object Level, and Object Code report across fund groups
Assists in easily assessing and comparing trends in net operations and budget-to-actual comparisons of one or more academic schools/colleges
Identifies movements in potential liquid resources available for re-investment by fund group, sub-fund group, and detailed account balances over time
Shows the relationships between income generated from instructional and program fees, and the degree to which schools have leveraged those resources providing direct support to students
Provides a set of metrics to identify positive and negative trends in the relationships between resources/activities and workforce size
STUDENT/ENROLLMENT
Displays historical trends and current course credit hour enrollments to plan for shifts in student demand and instructional workforce needs
Illustrates student major trends over time by student Career, Class Level and Degree Intent; Academic Department, and Academic Plan
Differentiates the total credit hours generated in a selected unit between students majoring in that RC vs other schools to allow strategic review of enrollment expansion opportunities
Supports strategic class scheduling through association of enrollments, class enrollment caps, classroom capacity, fill rates, and waitlist needs, and their interrelationships
Assists with the evaluation of course scheduling trends in the areas of standard meeting patterns, room ownership, and class start times to support the optimization of limited resources
Provides trends and relationships amongst course aggregations, student enrollments, and the mix of personnel teaching those courses by title group and employee rank
Shows the relationships between income generated from instructional and program fees, and the degree to which schools have leveraged those resources providing direct support to students
Illustrates success in meeting student waitlist needs over time at several levels including: responsibility center, department, course, and class
WORKFORCE PRODUCTIVITY
Illustrates academic FTE trends over time in relation to credit hour enrollments, research productivity, and unit staffing; and the degree to which the employee title group composition has shifted over time
Provides trends and relationships amongst course aggregations, student enrollments, and the mix of personnel teaching those courses by title group and employee rank
Identifies where units' teaching effort is dedicated (home unit vs away) displaying teaching/non-teaching (leave, admin, other) instructional headcounts by title group/rank
Illustrates sections taught trends over time and the relationship of the number of sections taught to faculty FTE, credit hours, courses, and class components
RESOURCE MANAGEMENT
Provides a set of metrics to identify positive and negative trends in the relationships between resources/activities and workforce size
Provides trends and relationships amongst course aggregations, student enrollments, and the mix of personnel teaching those courses by title group and employee rank
Identifies where units' teaching effort is dedicated (home unit vs away) displaying teaching/non-teaching (leave, admin, other) instructional headcounts by title group/rank
Identifies movements in potential liquid resources available for re-investment by fund group, sub-fund group, and detailed account balances over time
Supports strategic class scheduling through association of enrollments, class enrollment caps, classroom capacity, fill rates, and waitlist needs, and their interrelationships
Assists with the evaluation of course scheduling trends in the areas of standard meeting patterns, room ownership, and class start times to support the optimization of limited resources
Illustrates success in meeting student waitlist needs over time at several levels including: responsibility center, department, course, and class
REFERENCE
Reports the mapped connections from SIS academic course subjects and academic plans to the KFS financial organization structures, on which all AM360 displays are based
OVERVIEW
Provides an overview of several AM360 metrics for selected Campus and Responsibility Center including quick navigation to filtered dashboard content
Provides academic leaders and administrators a variety of perspectives on fiscal operating results and budget-vs-actual variance analyses for current operating funds.
Reports the mapped connections from SIS academic course subjects and academic plans to the KFS financial organization structures, on which all AM360 displays are based
Provides a set of metrics to identify positive and negative trends in the relationships between resources/activities and workforce size

